|
|
Overview, Background, Development of the Algorithms, Determination of Board Positioning and Orientation , Segmentation of Individual Game Squares, Determination of Square Status, Implementation into Checkers Program, Conclusion.
Determination of Square Status
Once the segmentation was completed, it was possible to analyse the state of each individual tile to determine if a checkers piece was inside it and, if so, what colour it was.
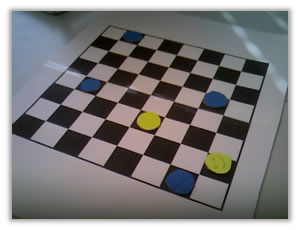
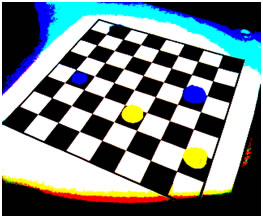
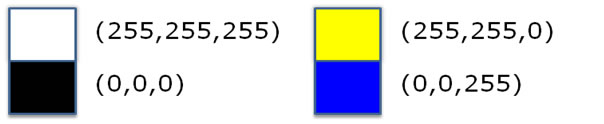
The basics of the technique is that the image is ‘colour reduced’ meaning that all RGB values are made to 0 or 255, which gives yellow/blue/black/white classification. The images below show pre and post-processing. As an example, all yellow pixels have an absolute value of (255,255,0).
The start of this process involved taking a selection of pixel values from inside each square and finding the predominant colour. Only a small selection of pixels were used as analysing the colour in a square, as opposed to every pixel because it still could identify the state of the square but also used much less processor power and time, which was important for our aim of real-time interaction.
Of a minor note, the pixels were not selected from the whole individual square but rather from a smaller square centred inside it. This was to avoid using pixels from neighbouring squares as the plane-geometry detection would have some error, especially in light of small movements of the camera and board.
The sampled pixels of an individual square were then analysed using a ‘colour reduction’ algorithm to classify them under the four main colours used in the game (black and white for the tiles, blue and yellow for the pieces).
If we consider a RGB colour, where black is given by (0,0,0) and white by (255,255,255) then we can say:
In an ideal image for analysis, all the pixels would have exactly these values and therefore would have been easy to classify.
Of course, theses pixel values were not expected to be perfect, so the data had to be processed first using the colour reduction algorithm.
First, contrast enhancement was performed to get black and white tiles as near as possible to (0,0,0) and (255,255,255) respectively. Whilst there were a few possible approaches to this, the following was used:
Squares which were known to be empty were pixel sampled. The average RGB values were taken for black and white squares and a mean RGB value set was determined for black and white. These values were used to normalise the pixel values

As a result, all black tile RGB values became close to their ideal values of (0,0,0) and the white, yellow and blue also did the same, as is shown below.
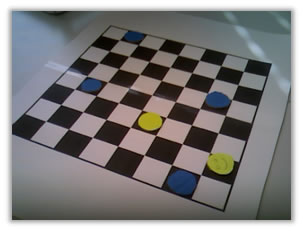 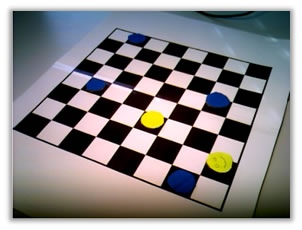
The left picture is pre-contrast enhancement and the right picture is post-contrast enhancement. Notice the difference in clarity of the pieces from the board.
Whilst the values were close to the ideal ones listed above, they still weren’t exactly those values, which meant that the program still couldn’t classify them yet.
So the next stage was to simply take the RGB values of a pixel and if they were less than 0.5, they were reduced to 0. If they were more than 0.5, they were increased to 1. This was because, after the contrast enhancement, the colours should have been closer to their ideal RGB values already.
So now, for an individual tile, there are sample pixels with colour reduced ideal values (1,1,0), (0,0,0), etc. Using a logic algorithm:
If >70% of pixels were (0,0,0) then the square was considered black, empty and ignored
Otherwise
If > 70% of pixels were (1,1,1) then the square was considered white, empty and ignored
Otherwise
All (0,0,0) and (1,1,1) were removed as they were considered pixels of the square that the checkers piece did not cover, leaving behind the yellow or blue pixels for analysis. From here, a similar approach was used to determine the colour of the piece.
|